Navigation – zooming – pins - city map
Navigation, zooming and pin placing is the same as in runner. Map showing options are also the same.
Select Line Colors→Monochrome Color to show all guideway segments black (or white if background is black).
Select Line Colors→Absolute Color to color the various guideway segments with a color (from green to red) that depends on their traffic. Green is for minimum traffic (=0%), red is for 100% (all the time the guideway segment was full of vehicles).
Select Line Colors→Relative Color to color the segments based on their average traffic. This time green is for minimum (=0%) and red is for the maximum average traffic measured during simulation.
Select Line Colors→Blocked Lines to color red the guideway segments which were blocked during the emergency event (meaningful only if a vehicle malfunction was ordered). Green guideway segments were unaffected by the event.
There is a starting point denoted by a blue cross and a circle. You can set its position by clicking anywhere in the map (it will be set only if the new position is in the network service area).
The program continuously calculates the time needed to go from the starting point to the current location of the mouse pointer. It shows this time at the bottom right of the screen (e.g. Needed Time:11:26 which means it takes 11 minutes 26 seconds to go from starting point to current mouse pointer).
How is this time calculated? A group can walk from its starting point to the current pointer location , or it can use the Hermes system. If it uses the system the program will take into account:
Some of these values are constant between different simulation executions on the same network: walking times,ticketing and guideway time.
Other values depend on traffic conditions: queue delay in origin station , delay due to network congestion, delay due to destination station congestion.
You can create a time map. The program calculates the time needed to go from the starting point to each point of the map and paint it accordingly:

Select Time Map→Create Map to create the map
Select Time Map→Create Fine Map to create a more detailed (and slower too) variation of the same map
Select Time Map→Set Time Colors to edit the range (in minutes) of each color zone (you can make for example green zone to be 15 minutes wide etc)
Note that during simulation the network may have failed to service some groups because of congestion. The number of these groups is reported (in general statistics dialog) but these groups are not taken into account when the program calculates average system delays . That happens because the average delay of 100 groups when 99 of them delayed 1 minute and 1 delayed infinitely (not serviced) is infinite, which would make no sense.
Select Statistics→General Statistics to see general statistical data about the simulation
Select Statistics→Station Statistics to see statistics regarding stations such as: station number, location (in parenthesis) , number of groups arrived, number of groups left , distance from source and sink capacitors in seconds (in parenthesis).
Select Statistics→Capacitor Statistics to see statistics about capacitors. Note that the number of used vehicles is (max vehicles in capacitor)-(min vehicles in capacitor) : That means that during simulation that number of vehicles was actually used , the rest stayed idle in capacitor. That gives us a hint about how big each capacitor should be.
Select Statistics→Line Statistics to see statistics about main guideway segments (offline guideway segments not included). Each segment has a pair of coordinates for the starting and ending point of the segment.
Select Statistics→Trip Statistics to see statistics about trips. Trips are grouped by their length (distance run on the guideway).
Select Statistics→Monte Carlo 300 X 300 to perform a Monte carlo simulation of size 300
Select Statistics→Monte Carlo 1000 X 1000 to perform a Monte carlo simulation of size 1000
Monte carlo 300 X 300 does this:
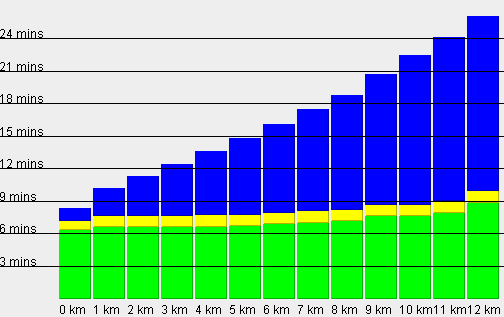
Each bar on the graph has 3 colors:
Please note that the trip lengths are straight line lengths : it is the geographic distance of the points – not the distance travelled. The distance travelled can be significantly larger (20%-40% , or even bigger for short trips). As for the distance travelled on guideways it is (because of steady guideway speed) proportional to the blue part of the bar.

Also a note on walking : Walking speed of a typical person is 4.8 km/hour. However in a city people rarely walk on a straight line. In order to compensate for this , presenter uses a lower speed (about 3.7km/hour) for its calculations (people moving in straight lines , like if they can get through buildings).