My Blog

Get a Heap Dump and Analyze it on MAT
This post is a reminder to me on how to use eclipse memory analyzer to watch for memory issues on an android application. And i write this post in hope that someone with more experience on such matter will give me some tips.
When it comes to mobile development, cpu and memory are two of the most important things that you must consider while writing your code. That’s why there are many useful tools that help the developer to watch for issues like memory leaks (pain in the ass!) and try to avoid or fix them.
In my case, i use (or better..try to understand and use) the eclipse memory analyzer (MAT).
What we will need?
-
1.Eclipse (here)
-
2.Eclipse MAT (here)
-
3.Android SDK - it can be downloaded directly from eclipse (help-> install new software - copy the link below in the window that appears : https://dl-ssl.google.com/android/eclipse/ and proceed with the steps given)
-
4.Your Android application - of course ;)
So let’s start!
Open your terminal and navigate to the location that the android-sdk was downloaded. In my Mac it was placed under the User directory. Then cd to the tools directory and hit the command
Thursday, February 23, 2012


By Jc
YourMac:tools YourUserName$ ./ddms
This will start the DDMS (Dalvik Debug Monitor) application. DDMS can be found in eclipse also but i prefer to use it standalone.
What does it do? It shows information about the emulator you are testing your application and displays running processes, memory usage, application heap size etc. So it helps a lot for monitoring your application.
With the Android emulator turned on and running your application, first find your applications’ record in the list on the left and then click the two buttons from the toolbar as the picture below shows. Finally click the Cause GC button.
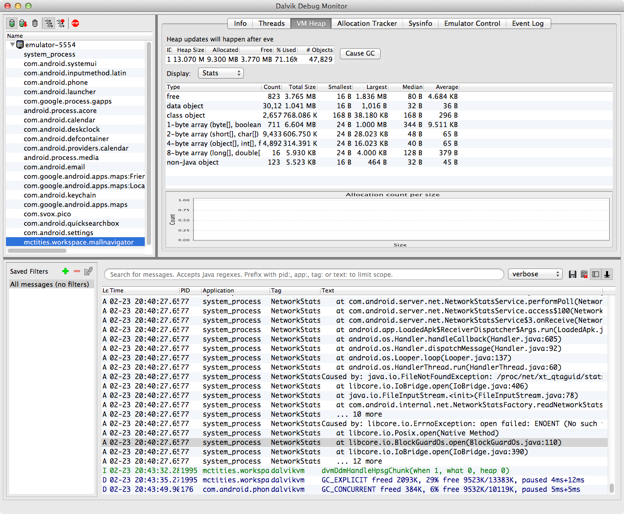
The first button we selected in the toolbar is for showing live heap updates when they occur and the second is for thread updates. Now that we have DDMS monitor our app, we start to play around with it and doing some staff (i.e change between your activities, tap your buttons - if any - scroll your Listview, etc.). While you use your app on the emulator, you will notice that DDMS if following you by changing values and everything as you tapping or scrolling through the app. When you are done playing, select from the toolbar the button besides the “show heap updates” button (tooltip text: dump HPROF file). In the dialog that will appear select a location to save your file ( make a directory and place it there..you will realize later why)
Now open a new terminal window and and navigate again up to the tools folder and run:

Show heap updates
Show thread updates

Cause GC

YourMac:tools YourUserName$ ./hprof-conv PATH_TO_HPROF_FILE PATH_TO_OUTPUT_FILE.hprof
PATH_TO_HPROF_FILE is the file that we saved earlier and the PATH_TO_OUTPUT_FILE is the file where the output of the hprof conversion will be saved. Append to the output file the extension .hprof. For convenience save the output in the same directory with the hprof file.
Now we are ready to open MAT and check our application for memory leaks.
Open MAT and go File -> Open Heap Dump... from the dialog window select your output.hprof file.
Now select the histogram button.
Here we see all the classes in the heap dump. To filter the table to show only your applications’ classes, type in the first row (<Regex>) your apps’ package name and hit enter. Now you will see only your classes. A few things about the columns:
Shallow Heap is the memory consumed by one object.
Retained Heap of X is the memory kept alive by X. (A Retained Set of X is a set o objects that will be removed by garbage collector when X is garbage collected.)
Now on the table we see which classes appear more than once and how much memory is retained by them. Firstly, Select a class or the class that you thing its getting a lot of memory (maybe the class that has values larger than 1 in object column..i think!), right click and go List objects -> with incoming references. This will show you the objects that refer to the selected entry. Secondly, right click to the first row and go Path to GC roots -> exclude weak/soft references. That shows to us the path of the garbage collector for the objects that referencing the class we selected on first step. So from here and on, depending on our applications’ purpose we can check if those objects should still be referencing our class. If not, we should check why they are kept alive by checking back our code and find a way to destroy them properly.
That’s for now...Here are some links that helped me :
And here is a video for memory management worth watching
Histogram
button